California City street map · Interactive
Why is California City empty?
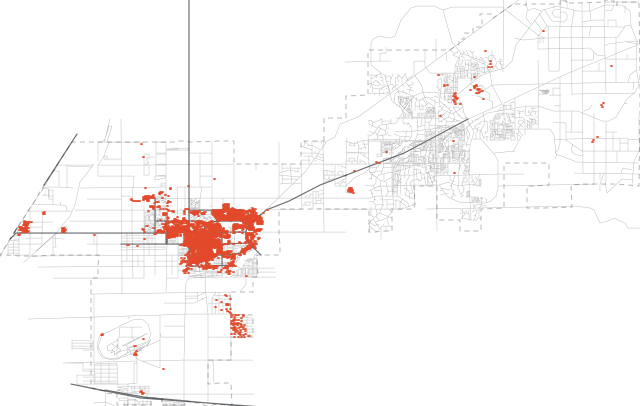
Because it was laid out for four hundred thousand people and about 13,000 came.85 From 1958 its developers graded and named streets across what became 203.7 square miles of the Mojave to sell as lots, and most of those lots went to buyers who never built on them.497 So California City is not abandoned and not a ghost town: it is a real town inside a street plan built for 400,000, and the map below shows every street and every building.
Click any street or building to see what it is.
Loading the street network…
Key
- Arterial roads
- Residential and local streets
- Tracks · appear as you zoom in
- Paths · appear closer still
- Buildings
- City limits
- Selected street or building
Street colours and weights are OpenStreetMap’s functional road classes. They say how a road is classed, not whether it is paved.
Every street and every building in California City, California: 1,332.7 miles of street laid out for 400,000 people, 84 per cent of them with no building within 100 metres.
- square miles
- 203.74Incorporated area. Third largest of any city in California.
- miles of street
- 1,332.71Across 3,813 mapped segments, 1,729 of them named.
- buildings
- 5,9412Covering 381 acres, about three tenths of one per cent of the city.
- residents
- 13,1745Census Bureau estimate for 2024, down from 14,971 in 2020.
Street and building figures are measured from the data the map draws; area and population are the Census Bureau’s. Every one of them is sourced below, and the derivation is in scripts/build_grid_data.py.
The map, described
California City occupies 203.7 square miles of the Mojave Desert, an area larger than every California city except Los Angeles and San Diego. Its street grid covers most of that area in rectangular blocks (about two thirds of the network’s length runs within five degrees of due north–south or due east–west), with the remainder angling off it. The main through routes are California City Boulevard, Neuralia Road, Twenty Mule Team Parkway and Randsburg Mojave Road.
The buildings are not spread across that grid. Ninety-two per cent of them stand in one compact block either side of California City Boulevard, roughly a third of the way in from the western edge and slightly south of centre. Three much smaller clusters sit apart from it: one to the south around Palisades Boulevard and Sierra Road, one on the far western edge near Poppy Boulevard, and a thin scatter to the north-east around Kennedy Boulevard. Outside those four areas the grid is essentially empty: streets and intersections with nothing on them, running to the city limits in every direction.
In numbers: 1,332.7 miles of platted street, 5,941 buildings, and 1,119.4 miles (84 per cent of the network) with no building within 100 metres.
What does the California City street map show?
The pale lines are streets. There are 1,332.7 miles of them inside the city limits, laid out across 3,813 mapped segments, and 1,729 of them have names.1 The orange marks are buildings: every building that open data knows about, all 5,941 of them.2
The ratio between those two things is the whole story. Zoom out and the buildings collapse into a single smudge in the middle of a street plan the size of a county. Zoom in anywhere outside that smudge and you will find graded, named, mapped streets running to intersections that have never had anything on them.
Put a number on it: 1,119.4 of those 1,332.7 miles (84 per cent) have no building within 100 metres of them. That is a deliberately generous radius. A hundred metres is wider than any lot here, so a street only falls into that count when there is genuinely nothing along it.
Is California City a ghost town, or abandoned?
No. A ghost town is a place people left, and California City is a place most people never came to. About 13,000 people live there.5 The state counted 5,429 homes on 1 January 2026, and 4,795 of them were occupied.6
What looks abandoned in aerial footage and photographs is the grid around the town: streets that were graded and named and then never built on. On the map, the town is the dense cluster of orange near the middle. Everything else is the part of the plan that nobody arrived to fill, and nothing on those streets was ever there to be left behind.
How big is California City, and how much of it was built?
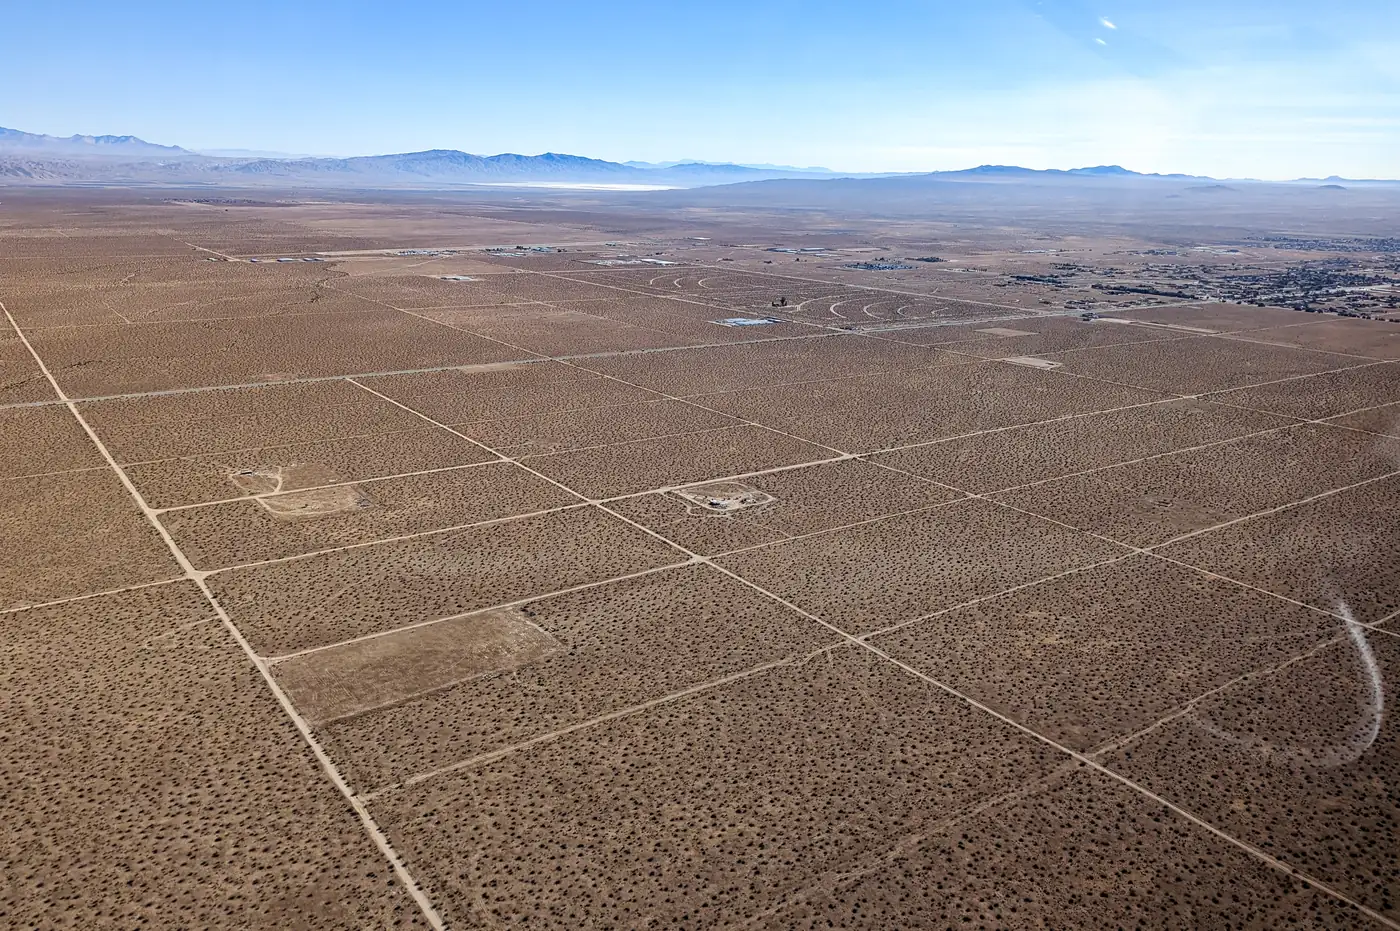

California City covers 203.7 square miles, the third largest area of any city in California.4 The Census Bureau estimates 13,174 people lived there in 2024, down from 14,971 at the 2020 base.5 That is a little over three per cent of the number the streets were drawn for, and the direction of travel is currently down, not up.
The city’s own parcel inventory, compiled by its planning department in 2010 and published in the 2015–2023 Housing Element, counts 50,604 parcels covering 130,200 acres. Of those, 36,007 are vacant and zoned residential, and they account for 108,460 acres: eighty-three per cent of the city’s land.7
Every building in California City put together covers 381 acres.2 Against 130,200, that is under three tenths of one per cent.
What was California City planned to be?
In 1958 Nat Mendelsohn bought roughly eighty thousand acres of the Mojave and commissioned a master plan for four hundred thousand residents.8 When California City incorporated in 1965 its boundaries were drawn around the whole plat rather than the inhabited part of it, which is why 203.7 square miles of desert is a single city.4
The streets came first because the streets were the product. Grading a road and filing a subdivision map is what turns desert into lots, and lots were what California City sold, to buyers in Los Angeles, and then across the country, and then abroad, most of whom never saw the land.9 The infrastructure went in far ahead of any demand for it, and the demand never arrived.
That business outlived the city’s own growth by six decades, through a 1977 Federal Trade Commission settlement and, most recently, a state fraud case that finished paying out in 2026. The grid on this map is the physical residue of it.
.jpg)
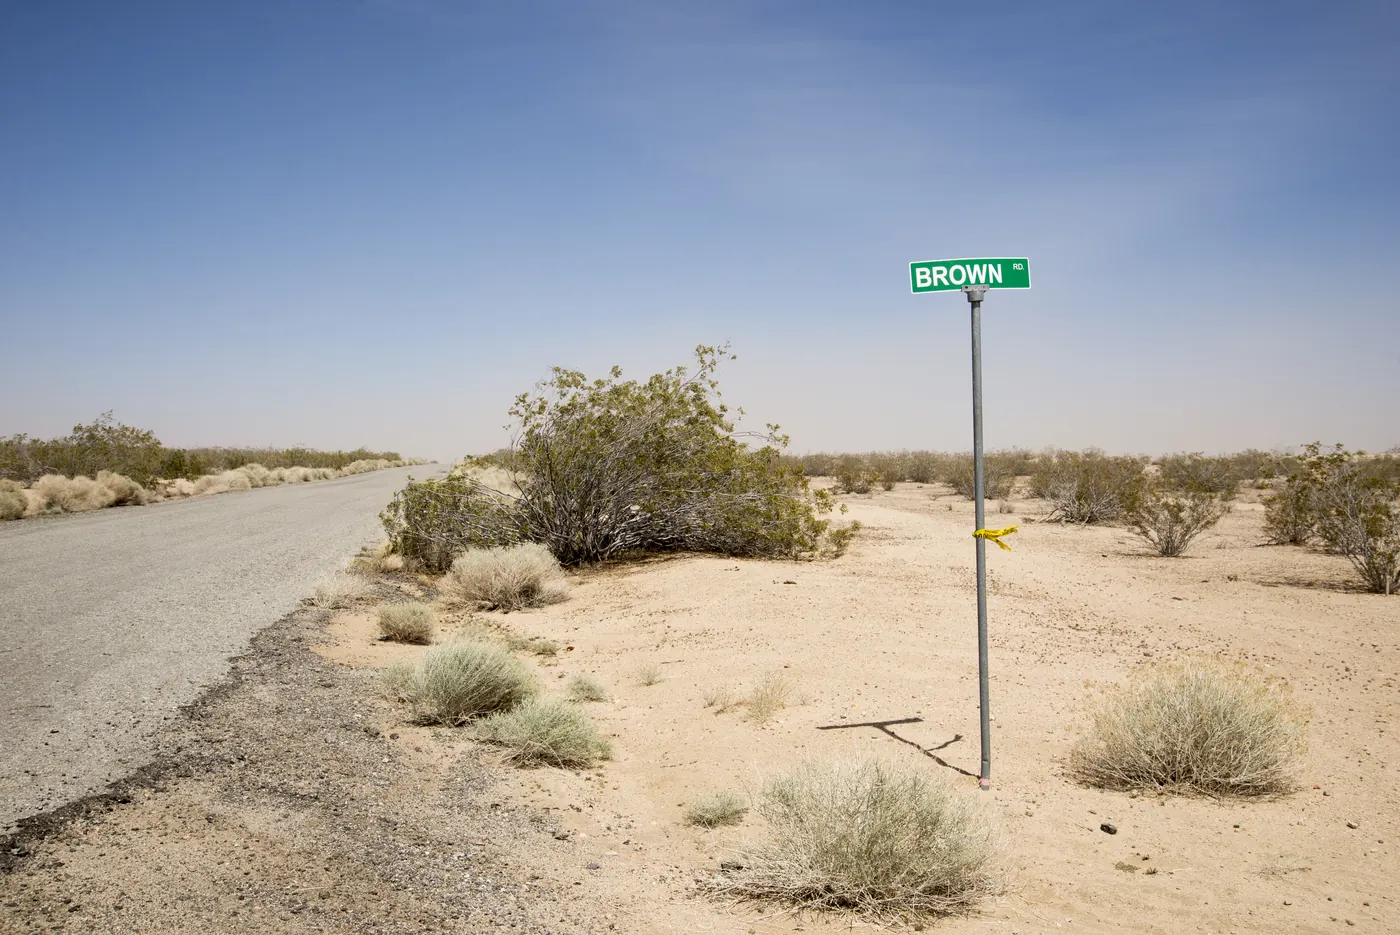
What riders make of the empty streets now is in OHV riding in California City; the town’s population, ZIP code and the rest of the essentials are in California City at a glance.
Where the sources disagree about vacant lots
The Housing Element contradicts itself on the vacancy figure, and the contradiction is worth showing rather than tidying away. Table 5.3 gives 50,604 as the total parcel count: 36,007 vacant residential parcels plus 14,597 parcels recorded as in use. Thirty pages later the same document states that “there are more than 50,604 subdivided vacant lots in California City”, which would make every parcel in the city vacant, including the ones its own table lists as built on.7
The table is the more careful of the two, so the figure used above is 36,007. Anyone citing 50,604 vacant lots (and the number does circulate) is quoting the sentence rather than the inventory.
The underlying parcel data is also dated 2010, and the document carrying it covers 2015 to 2023. It is the most complete public count that exists, and it is fifteen years old. Treat it as the order of magnitude it is.
Two smaller disagreements, for completeness. The Census Bureau puts the city at 203.7 square miles;4 the boundary as drawn in OpenStreetMap computes to 204.03, a difference of about a sixth of a per cent, which is boundary-tracing precision rather than a real dispute. And the map above is drawn from the OpenStreetMap boundary, because that is the line the street data is clipped to.
How does the map decide what is built?
There is no parcel layer on this map. Kern County’s assessor data would be the obvious source for one, and it is deliberately not used here: its licensing terms are unverified, and the question this map asks does not need it.
Instead, built means a building footprint stands there. Footprints come from Microsoft’s open building dataset, which detects outlines from satellite imagery and publishes them under the same licence as OpenStreetMap.2 Inside the city limits it holds 5,883 footprints, against 3,803 in OpenStreetMap; it contains a match for 98.5 per cent of the OpenStreetMap set, so it is used as the base layer and the 58 footprints only OpenStreetMap has are merged in. Total: 5,941.
The honest caveats. Machine detection from imagery is good but not certified complete, so a small building under a tree, or one finished after the imagery was flown, may be missing. A shed, a water tank and a house all count as a building here. And a vacant lot on this map is a lot with nothing standing on it, which says nothing about who owns it, whether it has water, or whether anyone could build on it.
None of which makes this a property map. It is a picture of what is standing where, drawn from open data: it is not a zoning map, it does not show lot lines, and it cannot tell you what may be built on a given parcel or who owns it. The Kern County Assessor holds the parcel record, and questions that turn on a property line belong there.
What the map does not show is road surface. OpenStreetMap records a surface for 319 of the 3,813 street segments, and filling in the other ninety per cent would mean inventing it. The street colours here are OpenStreetMap’s own functional road classes (arterial, residential, track, path) and nothing more. Whether a given street is paved, graded or drifting sand is a question this tool does not answer.
Sources and licences
The street network and city limits are © OpenStreetMap contributors, licensed under the Open Database Licence, as are Microsoft’s building footprints. The satellite imagery is United States federal work and in the public domain. The assembled dataset this page draws is published back under the same terms: network.json is the file the map fetches, and it is yours to use.
Found something wrong: a building that is not there, a street that is? Tell us and it will be fixed. Street and building errors are worth reporting to OpenStreetMap too, where the correction helps everyone.
- 1.California City street network and city limits. OpenStreetMap contributors, extracted 2026-09-17.Queried through the Overpass API and committed to this repository. Licensed under the Open Database Licence.
- 2.GlobalMLBuildingFootprints. Microsoft.Building outlines detected from satellite imagery and released under the Open Database Licence. 5,883 of them fall inside the city limits.
- 3.USGS Imagery Only: The National Map. U.S. Geological Survey.Aerial orthoimagery, mostly from the National Agriculture Imagery Program. United States federal work, in the public domain.
- 4.2020 Census Gazetteer Files: Places, California. U.S. Census Bureau, 2020.Records California City at 527,349,258 m² of land and 220,795 m² of water: 203.611 and 0.085 square miles.
- 5.Annual Estimates of the Resident Population for Incorporated Places (sub-est2024). U.S. Census Bureau, Population Estimates Program, 2024.California City: 14,971 at the 2020 estimates base, 13,174 estimated for 2024.
- 6.E-5 Population and Housing Estimates for Cities, Counties, and the State, 2020–2026. California Department of Finance, May 2026.Splits each year's estimate into people living in households and people in group quarters (institutions such as prisons), and counts housing units.
- 7.Housing Element Update 2015–2023, Table 5.3: Vacant Land Inventory by Residential Zoning District. City of California City Planning Department, data dated 2010.The city's own parcel inventory. Archived from this domain, which hosted the city's website until 2015.
- 8.California City, California. Wikipedia.Used here for the master plan's 400,000-resident target and the 1965 incorporation.
- 9.60 years of deception and land sales in California City: 7 takeaways from my investigative podcast. Emily Guerin, LAist, 2 September 2020.